
Academic · Product case study
A grocery store, decoded
One family-run grocery store’s daily sales, digitized and read for what to stock and where to put it.
- My contribution
- Solo data collection, analysis & reporting
- Project status
- Coursework capstone
What I built
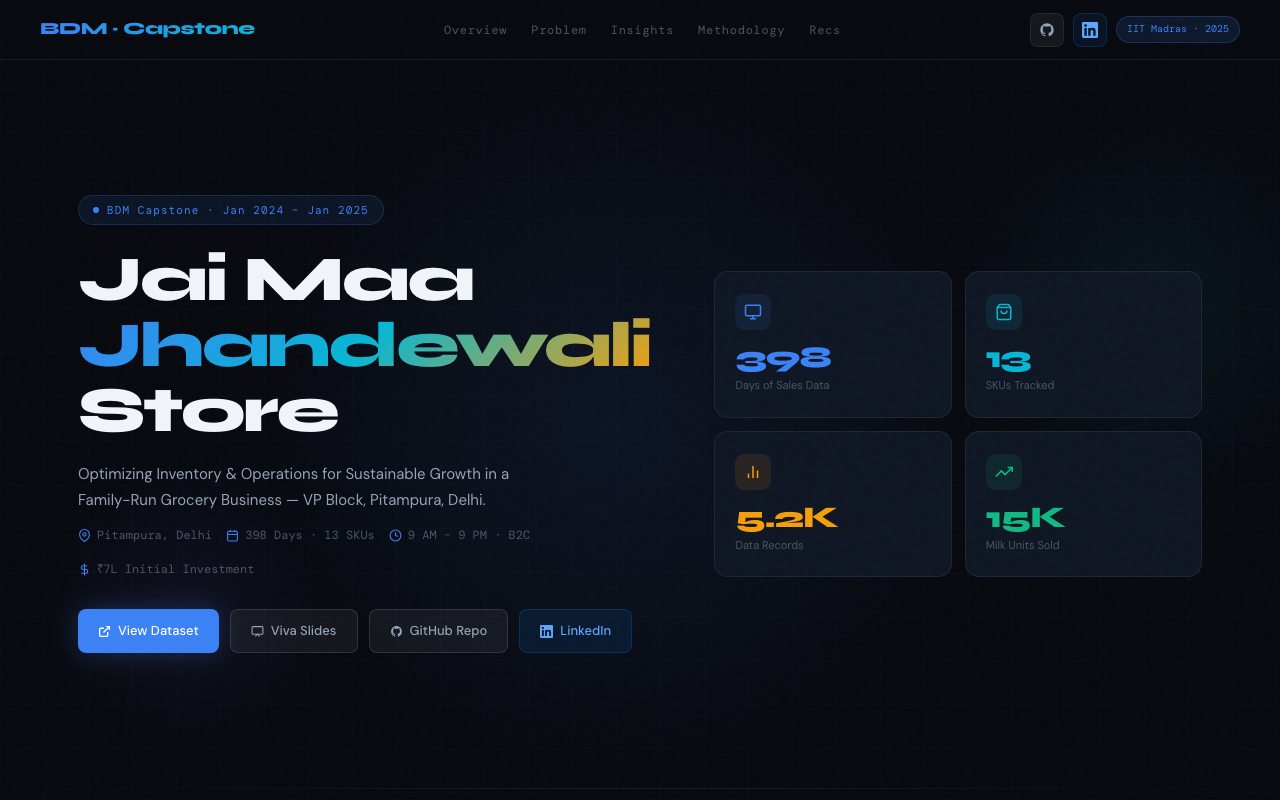
Digitized 398 days of sales from a family-run grocery store in Pitampura, then read its 13 SKUs through ABC segmentation, a correlation matrix and a milk-sales regression, publishing the charts and recommendations as a static coursework site.
The problem
A family-run grocery store in Delhi ran on manual records, with overstocking and stockouts on perishable items. Shelf space was severely constrained, and manual operations left little room to scale.
How I approached it
- Digitized daily sales for 13 SKUs across 398 days from the store’s own records and interviews.
- Ran descriptive statistics, trend analysis, ABC segmentation and a correlation matrix in Excel and Python, with a linear regression to forecast milk sales.
- Wrote up the inventory, space and growth recommendations and published them with the charts as a static Chart.js page.
The outcome
The report recommends ABC-based stocking, just-in-time ordering on perishables, vertical shelves with space given to the high-selling SKUs, and a POS for sales tracking. Any impact is projected rather than measured, and none of it was implemented — this was coursework, delivered as a report and viva slides.
Tools behind the work
 ExcelChart.jsTailwind CSSHTML
 CSS